

getty
Homebuilder stocks DR Horton, KB Home, Lennar, PulteGroup and Toll Brothers are not cheap after rising 141% to 237% from lows set between March 18 to March 23. DR Horton and Lennar set all-time intraday highs on Thursday, July 23.
Longer-term homebuilders are a buy when their P/E ratios are 8% and lower. Today they have P/E ratios between 9.62% and 12.80%.
Key Housing Statistics
The National Association of Home Builders (NAHB) Housing Market Index (HMI) plunged by a record 42 points to 30 in April, down from 72 in March. This reading then rose to 37 in May then back to 72 in July.
Single-family housing starts declined to 679,000 in April then rose to 709,000 in May and to 831,000 in June. The low was down 34% from the February peak. The June level is still down 3.9% year-over-year.
Graph of NAHB HMI versus Single-Family Starts
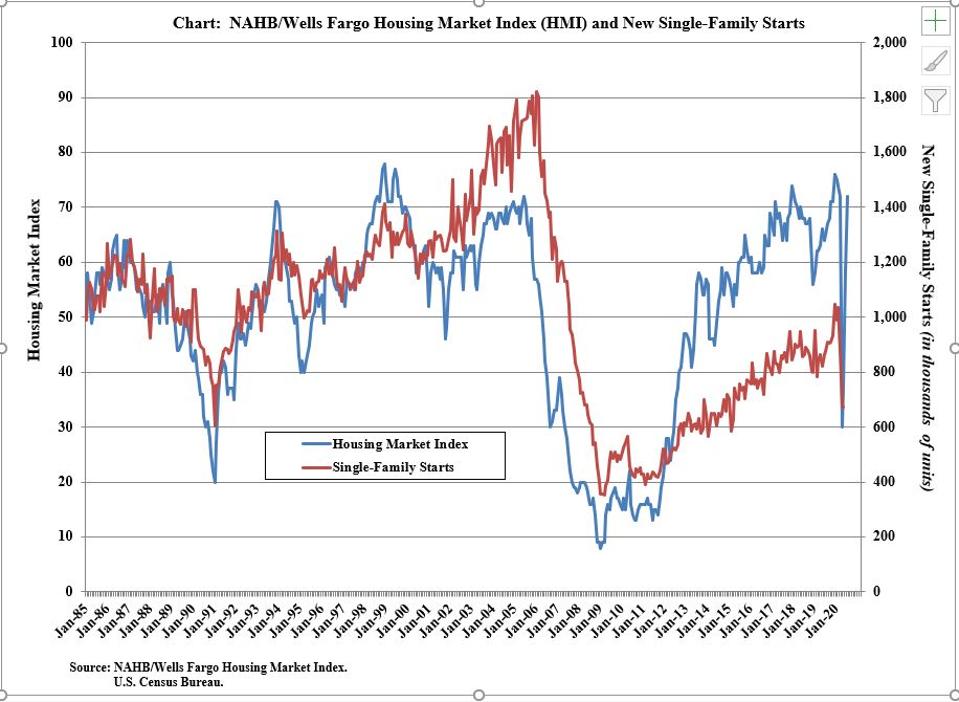
NAHB
The scale on the left is the Housing Market Index, which is the blue line across the graph. The scale on the right is Single-Family Starts in red on the chart. At the right side of the graph and you will see the 42-point drop to 30 for HMI in April, and the rebound in May, June, and July back to 72. The Single-Family Starts level is the 831,000 for June.
S&P CoreLogic Case-Shiller 20-City Composite

Case- Shiller
Home prices continue to be in a reinflating bubble. The latest reading from the S&P CoreLogic Case-Shiller 20-City Composite is for April. It first peaked in July 2006. The trough occurred in March 2012. The decline totaled 35.1%. The current reading for April is 67.1% above the March 2012 low and is 8.5% above the 2006 high.
With mortgage rates at record lows, home prices remain elevated.
Here is a Scorecard for the Five Major Homebuilders

Homebuilder Scorecard
DR Horton (DHI, $63.88) has a positive but overbought weekly chart as the stock traded to an all-time intraday high of $66.66 on July 23. The stock has a P/E ratio of 12.80%. This homebuilder has beaten earnings per share estimates for five consecutive quarters. The stock is up 150.4% from its March 18 low of $25.51, which justifies profit taking. Its annual pivot at $58.05 should be a magnet.
KB Home ( KBH , $33.09) has a positive weekly chart as the stock attempts to rally to its annual risky level at $37.36 where profits should be taken. The stock has a P/E ratio of 9.62% and is up 237% from its March 19 low of $9.82. This homebuilder missed earnings per share estimates on June 24 ending a 17-quarter winning streak.
Lennar (LEN, $70.08) has a positive but overbought weekly chart as the stock traded to an all-time intraday high of $73.75 on July 23. The stock has a P/E ratio of 10.29%. This homebuilder has beaten earnings per share estimates for five consecutive quarters. The stock is up 175.7% from its March 18 low of $25.42, which justifies profit taking. Its annual pivot at $58.05 should be a magnet. Its annual risky level is $75.17.
PulteGroup ( PHM ,$41.29) has a positive weekly chart as the stock rallies towards its annual risky level at $45.47. The stock has a P/E ratio of 10.05%. This homebuilder has beaten earnings per share estimates for 14 quarters in a row. The stock is up 141.2% from its March 23 low of $17.12, which justifies profit taking.
Toll Brothers ( TOL , $36.60) has a positive weekly chart with the stock below its annual risky level at $52.44. The stock has a P/E ratio of 10.07%. The company missed earnings per share estimates on February 25, which ended an eight-quarter winning streak. The stock is up 175.6% since trading as low as $13.28 on March 18.