
Affordable homes and low exposure to volatile industries should help some metros weather the storm
Affordable East Coast and Midwest cities have the lowest overall economic risk in the 2020 recession that began in March, according to a new analysis by Redfin. The one-two punch of the coronavirus (COVID-19) and an oil price war between Saudi Arabia and Russia has rapidly brought to reality a possibility that seemed remote just a few months ago, but the impact in the real estate market is likely to be short-lived and much less extreme than the 2008 Great Recession.
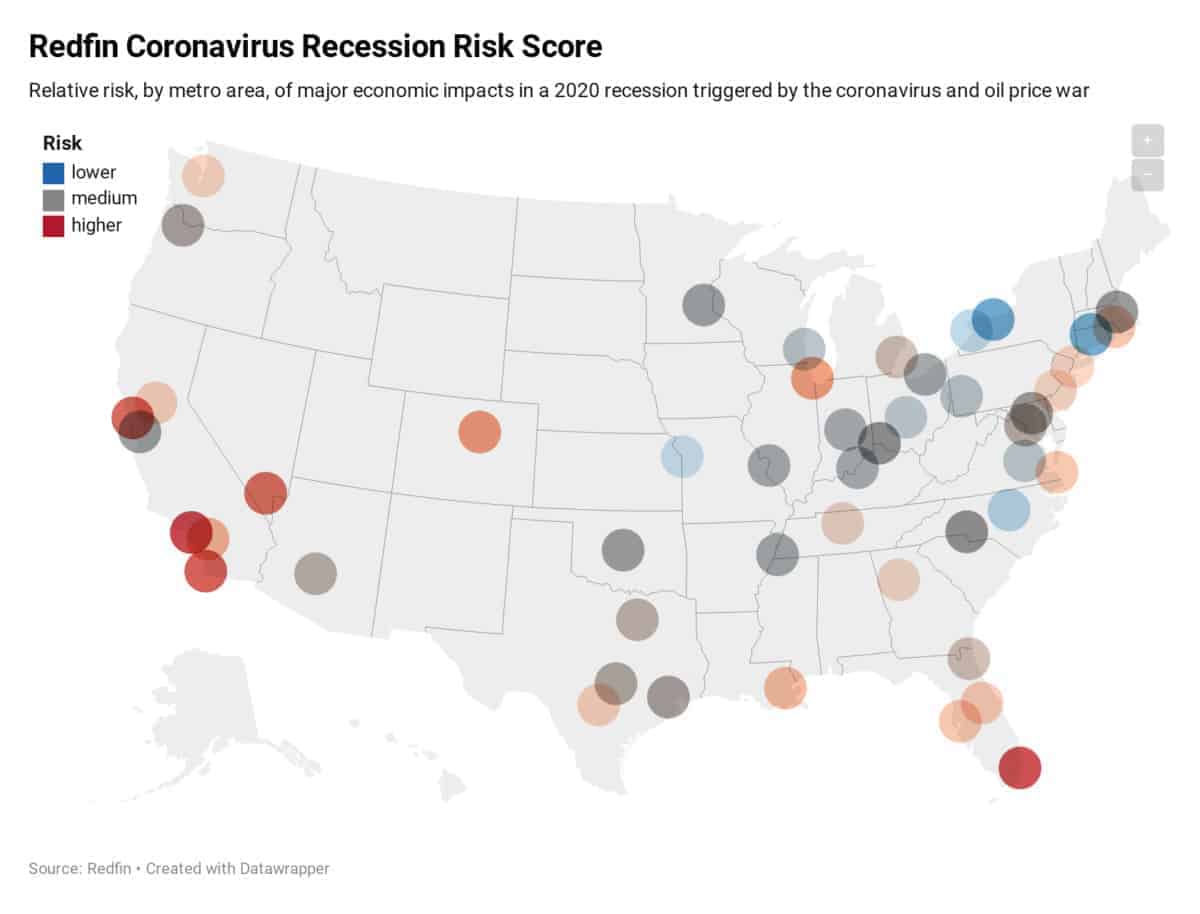
Rochester, Hartford, and Raleigh have the lowest overall economic risk in this recession, while Los Angeles, Miami, and San Diego have the highest risk, based on a late March 2020 analysis by Redfin economists.
Housing is Well Positioned to Weather This Storm
Because the housing market was strong going into the 2020 recession, there’s currently no reason to expect a major crash in home prices. In fact, the driving factors for this 2020 recession are unrelated to real estate, which is just one of the reasons at this time we believe fallout in the U.S. real estate market will be mild, and nowhere near the catastrophe of the 2008 Great Recession.
“The housing market came into this turmoil in a strong position, with a very low supply of homes for sale and record levels of home equity,” said Redfin lead economist Taylor Marr. “Home equity can function as a rainy day fund. Homeowners can weather a storm of falling home values without the pressure to walk away from their home. They can also better handle a loss of income if they can tap into their equity with a home equity line of credit (HELOC). This stabilizes the market, preventing an influx of supply from foreclosures, which would further cause prices to fall in a vicious cycle. Additional government support provided through the stimulus bill CARES Act and a moratorium on foreclosures can also prevent a falling out during this pandemic.”
Metro Area Rankings of Recession Risk
To evaluate the potential impact of the 2020 recession on the local economies of the 49 largest U.S. cities we analyzed a variety of general factors, as well as some specific to this recession, such as rates of leisure and hospitality employment, debt-to-income ratios, number coronavirus cases and air transportation employment. For the full explanation of how we calculated the overall economic risk score, see the methodology section below.
Low Density and Low Debt-to-Income Ratios Help Insulate Against Risk
Cities in the Midwest and on the East Coast are set to fare best during the 2020 recession, led by Rochester, NY, with just a 28.5% recession risk, Hartford, CT (29.5%) and Raleigh, NC (36.9%). The most common factors among the cities that will fare the best were low population density, low debt-to-income ratios, little dependence on air transportation employment and historically low home price volatility.
In general, the cities that have more affordable housing, less personal debt, and more people employed in jobs that can be done from home are likely to be the most insulated from the 2020 recession.
Metros With Lowest Economic Risk in a Coronavirus 2020 Recession
| Rank | Metro Area | Recession Risk Score |
|---|---|---|
| 1 | Rochester, NY | 28.5% |
| 2 | Hartford, CT | 29.5% |
| 3 | Raleigh, NC | 36.9% |
| 4 | Buffalo, NY | 37.6% |
| 5 | Kansas City, MO | 39.0% |
| 6 | Columbus, OH | 42.9% |
| 7 | Richmond, VA | 43.2% |
| 8 | Pittsburgh, PA | 43.9% |
| 9 | Milwaukee, WI | 44.0% |
| 10 | Indianapolis, IN | 46.2% |
High Debt, High Density and Expensive Housing Make Some Cities More Susceptible
While many cities are expected to weather the 2020 recession, some will be harder hit than others. Because the impacts on other, non-housing sectors of the economy, especially employment, are likely to be very large, some metro areas face a greater economic risk during the 2020 recession. Those that are hit the hardest overall are also likely to be more at risk of a real estate downturn.
“Some cities have factors that make them more susceptible to losing their footing and are likely to be hard hit,” continued Marr. “Amidst rapidly rising layoffs, it will be especially difficult to sell a home in these markets, and yet buyers will likely find limited options as sellers delay listing, leaving the housing market in a standstill. Federal support will help cushion the fall, but in these areas it will take significantly longer to recover.”
The cities most likely to face economic risk tend to be those with high home prices, high levels of personal debt, and large numbers of people employed in the hospitality industry, which applies to most of the big cities in the West. San Jose (48.4%) is the only metro area in the West with a recession risk score below 50%.
The metro area with the highest risk of economic damage during this coronavirus recession is Los Angeles, with an overall score of 77.6%, followed by Miami (76.8%) and San Diego (75.2%). Chicago and Denver stand out as unusual among the 10 metros at greatest risk as, unlike most others on the list, neither is a typical “boom-bust” town. Both have relatively high population density, large employment bases in air transportation and a large rate of existing coronavirus cases, which drove up their overall risk scores.
Similar to our September analysis, the most at-risk areas overlap with places where housing was hit hardest by the Great Recession and are clustered in California and Florida. Five of the 10 most at-risk cities are in California; three are in Florida.
Metros With Highest Economic Risk in a Coronavirus 2020 Recession
| Rank | Metro Area | Recession Risk Score |
|---|---|---|
| 40 | Providence, RI | 63.7% |
| 41 | New Orleans, LA | 64.7% |
| 42 | Riverside, CA | 66.1% |
| 43 | Chicago, IL | 68.7% |
| 44 | Denver, CO | 69.4% |
| 45 | Las Vegas, NV | 73.9% |
| 46 | San Francisco, CA | 74.4% |
| 47 | San Diego, CA | 75.2% |
| 48 | Miami, FL | 76.8% |
| 49 | Los Angeles, CA | 77.6% |
Below is the full table with the rankings for each of the four recession risk factors for each of the 49 largest metro areas in the US.
Relative Economic Risk in a Coronavirus 2020 Recession, by Metro Area, Ranked Highest to Lowest Risk
| Rank | Metro Area | Recession Risk Score | Leisure & Hospitality Employment | Debt-to-Income Ratio | Coronavirus Cases per 100k as of March 24 | Population Density | Imports from China, % of GDP | State Oil Production | 65+ Households, % of Total | Air Transportation Employment | Loan to Value Ratio | Home Price to Income Ratio | Home Price Volatility | Flips Share of Home Sales | Employment Diversity |
|---|---|---|---|---|---|---|---|---|---|---|---|---|---|---|---|
| 1 | Rochester, NY | 28.5% | 2% | 10% | 33% | 21% | 29% | 35% | 90% | 0% | 10% | 2% | 15% | 48% | 44% |
| 2 | Hartford, CT | 29.5% | 0% | 10% | 38% | 27% | 8% | 0% | 88% | 50% | 73% | 6% | 27% | 4% | 23% |
| 3 | Raleigh, NC | 36.9% | 60% | 69% | 15% | 8% | 48% | 0% | 4% | 35% | 54% | 52% | 21% | 23% | 31% |
| 4 | Buffalo, NY | 37.6% | 46% | 0% | 19% | 50% | 29% | 35% | 94% | 2% | 71% | 4% | 4% | 13% | 71% |
| 5 | Kansas City, MO | 39.0% | 35% | 31% | 71% | 17% | 25% | 0% | 44% | 23% | 33% | 0% | 48% | 63% | 69% |
| 6 | Columbus, OH | 42.9% | 23% | 31% | 10% | 40% | 52% | 69% | 17% | 69% | 90% | 23% | 8% | 44% | 56% |
| 7 | Richmond, VA | 43.2% | 19% | 69% | 58% | 15% | 38% | 0% | 60% | 6% | 94% | 44% | 35% | 52% | 38% |
| 8 | Pittsburgh, PA | 43.9% | 42% | 0% | 23% | 31% | 44% | 63% | 98% | 40% | 92% | 6% | 52% | 2% | 40% |
| 9 | Milwaukee, WI | 44.0% | 6% | 10% | 67% | 69% | 71% | 0% | 56% | 27% | 60% | 35% | 67% | 10% | 31% |
| 10 | Indianapolis, IN | 46.2% | 35% | 31% | 63% | 6% | 73% | 48% | 27% | 46% | 33% | 17% | 35% | 73% | 65% |
| 11 | Louisville, KY | 46.4% | 46% | 10% | 35% | 23% | 79% | 48% | 73% | 23% | 65% | 23% | 29% | 31% | 83% |
| 12 | St. Louis, MO | 46.7% | 60% | 31% | 46% | 29% | 25% | 0% | 79% | 44% | 75% | 13% | 67% | 29% | 50% |
| 13 | Memphis, TN | 47.1% | 46% | 0% | 75% | 10% | 98% | 35% | 33% | 10% | 56% | 23% | 23% | 90% | 98% |
| 14 | Cleveland, OH | 47.2% | 19% | 0% | 56% | 38% | 52% | 69% | 92% | 50% | 65% | 6% | 8% | 44% | 54% |
| 15 | Minneapolis, MN | 47.6% | 8% | 44% | 65% | 54% | 77% | 0% | 25% | 81% | 75% | 35% | 42% | 6% | 10% |
| 16 | Oklahoma City, OK | 47.9% | 71% | 31% | 27% | 23% | 35% | 92% | 29% | 15% | 63% | 17% | 56% | 48% | 73% |
| 17 | San Jose, CA | 48.4% | 4% | 0% | 42% | 90% | 83% | 77% | 21% | 15% | 29% | 96% | 100% | 23% | 21% |
| 18 | Boston, MA | 48.7% | 27% | 10% | 77% | 92% | 10% | 0% | 69% | 60% | 8% | 83% | 77% | 0% | 6% |
| 19 | Cincinnati, OH | 49.7% | 71% | 10% | 54% | 13% | 52% | 69% | 54% | 48% | 85% | 13% | 13% | 35% | 58% |
| 20 | Charlotte, NC | 50.5% | 69% | 54% | 60% | 0% | 48% | 0% | 23% | 92% | 25% | 56% | 56% | 35% | 65% |
| 21 | Baltimore, MD | 51.8% | 23% | 69% | 50% | 71% | 6% | 0% | 69% | 67% | 96% | 23% | 17% | 71% | 13% |
| 22 | Houston, TX | 52.2% | 54% | 10% | 40% | 60% | 60% | 94% | 2% | 77% | 33% | 42% | 0% | 63% | 52% |
| 23 | Portland, OR | 52.6% | 31% | 83% | 44% | 73% | 13% | 0% | 40% | 60% | 88% | 81% | 44% | 19% | 8% |
| 24 | Austin, TX | 53.2% | 90% | 44% | 13% | 48% | 60% | 94% | 0% | 29% | 33% | 60% | 29% | 23% | 77% |
| 25 | Washington, DC | 53.7% | 27% | 69% | 79% | 81% | 0% | 0% | 13% | 65% | 98% | 52% | 54% | 56% | 0% |
| 26 | Phoenix, AZ | 54.2% | 35% | 83% | 6% | 67% | 15% | 0% | 75% | 50% | 4% | 67% | 96% | 98% | 75% |
| 27 | Dallas, TX | 54.6% | 46% | 10% | 31% | 63% | 60% | 94% | 6% | 96% | 33% | 21% | 23% | 77% | 85% |
| 28 | Jacksonville, FL | 56.0% | 77% | 83% | 48% | 4% | 17% | 48% | 67% | 50% | 19% | 48% | 40% | 35% | 92% |
| 29 | Detroit, MI | 56.1% | 15% | 10% | 85% | 35% | 58% | 60% | 83% | 79% | 27% | 31% | 94% | 58% | 25% |
| 30 | Nashville, TN | 58.3% | 77% | 44% | 90% | 2% | 98% | 35% | 19% | 31% | 46% | 73% | 17% | 63% | 81% |
| 31 | Atlanta, GA | 59.1% | 56% | 54% | 96% | 19% | 81% | 0% | 8% | 100% | 13% | 44% | 63% | 69% | 60% |
| 32 | Philadelphia, PA | 60.5% | 8% | 44% | 81% | 83% | 44% | 63% | 79% | 50% | 21% | 69% | 50% | 31% | 40% |
| 33 | New York, NY | 60.7% | 8% | 10% | 100% | 100% | 29% | 35% | 77% | 71% | 23% | 90% | 65% | 52% | 25% |
| 34 | Seattle, WA | 61.1% | 15% | 54% | 94% | 79% | 75% | 0% | 15% | 83% | 83% | 92% | 81% | 15% | 4% |
| 35 | San Antonio, TX | 61.7% | 92% | 54% | 21% | 44% | 60% | 94% | 29% | 21% | 33% | 48% | 73% | 77% | 88% |
| 36 | Sacramento, CA | 61.8% | 31% | 94% | 17% | 58% | 83% | 77% | 60% | 15% | 56% | 85% | 56% | 73% | 19% |
| 37 | Orlando, FL | 62.4% | 98% | 54% | 29% | 33% | 17% | 48% | 46% | 85% | 17% | 69% | 77% | 85% | 90% |
| 38 | Tampa, FL | 63.1% | 77% | 69% | 25% | 40% | 17% | 48% | 100% | 42% | 6% | 60% | 92% | 92% | 96% |
| 39 | Virginia Beach, VA | 63.1% | 75% | 94% | 88% | 46% | 38% | 0% | 50% | 10% | 100% | 31% | 44% | 83% | 29% |
| 40 | Providence, RI | 63.7% | 77% | 69% | 83% | 56% | 42% | 0% | 85% | 6% | 50% | 60% | 88% | 35% | 46% |
| 41 | New Orleans, LA | 64.7% | 96% | 44% | 98% | 65% | 2% | 75% | 65% | 33% | 31% | 56% | 2% | 19% | 60% |
| 42 | Riverside, CA | 66.1% | 58% | 100% | 0% | 52% | 83% | 77% | 48% | 4% | 50% | 85% | 98% | 88% | 77% |
| 43 | Chicago, IL | 68.7% | 42% | 31% | 73% | 94% | 96% | 67% | 50% | 90% | 65% | 35% | 29% | 15% | 46% |
| 44 | Denver, CO | 69.4% | 65% | 69% | 92% | 75% | 4% | 90% | 10% | 92% | 81% | 77% | 4% | 58% | 17% |
| 45 | Las Vegas, NV | 73.9% | 100% | 83% | 2% | 77% | 69% | 35% | 42% | 88% | 13% | 75% | 85% | 100% | 100% |
| 46 | San Francisco, CA | 74.4% | 67% | 54% | 69% | 98% | 83% | 77% | 58% | 73% | 2% | 100% | 81% | 8% | 0% |
| 47 | San Diego, CA | 75.2% | 94% | 94% | 4% | 85% | 83% | 77% | 38% | 38% | 75% | 94% | 90% | 81% | 15% |
| 48 | Miami, FL | 76.8% | 85% | 54% | 52% | 88% | 17% | 48% | 96% | 98% | 0% | 79% | 71% | 92% | 94% |
| 49 | Los Angeles, CA | 77.6% | 88% | 83% | 8% | 96% | 83% | 77% | 33% | 75% | 48% | 98% | 73% | 96% | 31% |
Methodology
To identify the markets most likely to have their local economy severely impacted during the 2020 recession, we looked at the following factors, with the following weights. For each metro area, we came up with an overall risk score based on the weighted average of the risk percentiles in each category relative to the 48 other metros.
- Density of leisure & hospitality employment (weight: 1.5, higher is riskier)
- Median debt-to-income ratio (weight: 1.5, higher is riskier)
- Metro Area coronavirus cases per 1 million people as of March 24 (weight: 1.5, higher is riskier)
- Population density (weight: 1.0, higher is riskier)
- Percent of state GDP made up of imports from China (weight: 1.0, higher is riskier)
- State oil production (weight: 1.0, higher is riskier)
- Percent of households age 65 or older (weight: 1.0, higher is riskier)
- Density of air transportation employment (weight: 1.0, higher is riskier)
- Average loan-to-value ratio of homes sold in 2019 (weight: 0.5, higher is riskier)
- Median home sale price-to-household income ratio (weight: 0.5, higher is riskier)
- Home price volatility, measured by the standard deviation of home prices year-to-year (weight: 0.5, higher is riskier)
- Share of home sales that are flips, i.e. sold twice within 12 months for a different price (weight: 0.5, higher is riskier)
- Diversity of local employment, measured as the probability that any two randomly selected workers are in the same field (weight: 0.5, lower is riskier)
This post first appeared on Redfin.com. To see the original, click here.