
Home building’s 2020 sling-shot trajectory—coming as it did amidst the shock and stress of the pandemic—defied gravity. It’s one of American business and society’s few feel-good stories in a bleak, topsy-turvy backdrop. Sparked in early Spring, new home development’s run-up caught momentum in the Summer—and it looks like it’s barreling into the Fall. Fueling it, a triangulation of equal measures: historically pent up demand, Uncle Sam’s largesse, and an Animal Spirits cocktail of fear-of-missing-out, you-only-live-once, and biological clock effects.
National Association of Home Builders chief economist Robert Dietz helps quantify pent up demand by … [+]
Source: NAHB analsysis
Here’s a look at the outsized role one point in that geometry—structural pent up demand—is playing in the current market, that could prove to be less reliable as a predictor than many invested stakeholders are counting on right now.
An upside, still-widening consensus hypothesis of a housing-led broad economic recovery has taken meaningful hold of sentiment in the buyer-seller arena where it matters most—money for land. As new-home sales pace accelerates, logic follows that builders churn through home sites faster. Ergo, they need to replenish their lot supply pipelines to feed the machine. Trouble is, when every home building and development firm does that at one time, land prices skyrocket as tracts get multiple bids. They’re breaking a cardinal rule: Don’t go food shopping when you’re hungry. This bends builders’ costs upwards into the future, mapping land appreciation “escalators” into investment and loan models. All this with zero assurances household wages will be able to keep pace with those upward bending cost curves.
Amid the uncertainties at play, it’s scarcely too soon to challenge inputs and assumptions underlying high-stakes bets—and unpack which inputs and assumptions are hard data-points and which are squishy, fuzzy speculative catalysts. Residential real estate, as an asset class, is notorious for being entirely predictable, except for matters of timing, money, and place. Contagion happens when tons of money move into land buys based on models whose inputs turn out to be quasi-circular-reasoning and quasi-hunch. Big, big bets now among builders—that home building’s run-up will outrun the drag finally catching up with Wall Street’s juggernaut—hinge on five key conditions, each of whose evidence-base merits a double- and triple-reality check.
This is especially true for privately-held home building firms, whose principals most often personally guarantee loans for land acquisition and development from their own money.
These five conditions need to hold sustainably true into and beyond 2021 if they’re to underlie solid, sensible penciling of lots—as more land-buying strategies shift 180-degrees from defensive to offense—for a housing-led recovery scenario.
- The Federal Reserve will continue to go aggressively big in its monetary policy, to keep markets working and stable—effectively pumping capital into an economy that sorely needs it, but doesn’t know exactly what to do with it.
- That the confidence boost of housing’s rebound will eclipse and outlast the confidence dampener of a long, hard, widespread economic downturn.
- That belief in a V-shaped recession and rebound amounts to more than recency bias.
- That FOMO, YOLO, and Millennials in unison waking up to their biological clocks are more than reflexive fad, and instead evolve into a macro driver of demand into the three-to five-year horizon.
- Finally, that a rule of structural new-home demand—measured by most experts as newly constructed units per million population—will now revert to its norms.
Two imperatives matter here for smarter, sounder land-buying amid the current condition fever: 1. Each of these five conditions should be scaled with rigor with a confidence level, and 2. Query each of the data inputs in a disciplined, dispassionate way for real-world validity, rather than self-confirming biases.
Remember, less than a year ago, business outlook talk-tracks among both public and private builders, their partners, analysts, and experts bordered on counter-cyclical defensiveness and caution. Smart money foresaw a period of balance sheet risk reduction, chips off the table, rising interest rates. Even as they shifted product mix to emphasize lower-priced entry level offerings, their plans would double-down focus on land-light agility, focus on vertical construction direct-cost operational excellence, nimbleness, and opportunism. They anticipated weathering the muck and murk of a bumpier couple of years of intensified global trade disputes, slowing business fundamentals.
Come the pandemic this past winter, a shock-and-awe government response, and an unimagined adrenaline boost to new home buyer motivation, the residential building and development business and investment community turned on its heels.
Here’s the thing. When performance sours in home building and development, its business leaders quickly blame externalities as culprits. When fortunes spiral upward, however, they’ll nearly always take complete credit for masterful command of insight and market anticipation.
What they could never have anticipated with the onset of Covid-19—widespread fear of density, and extra time on one’s hands—have played at least some role in what feels to be an opening of the sluice gates.
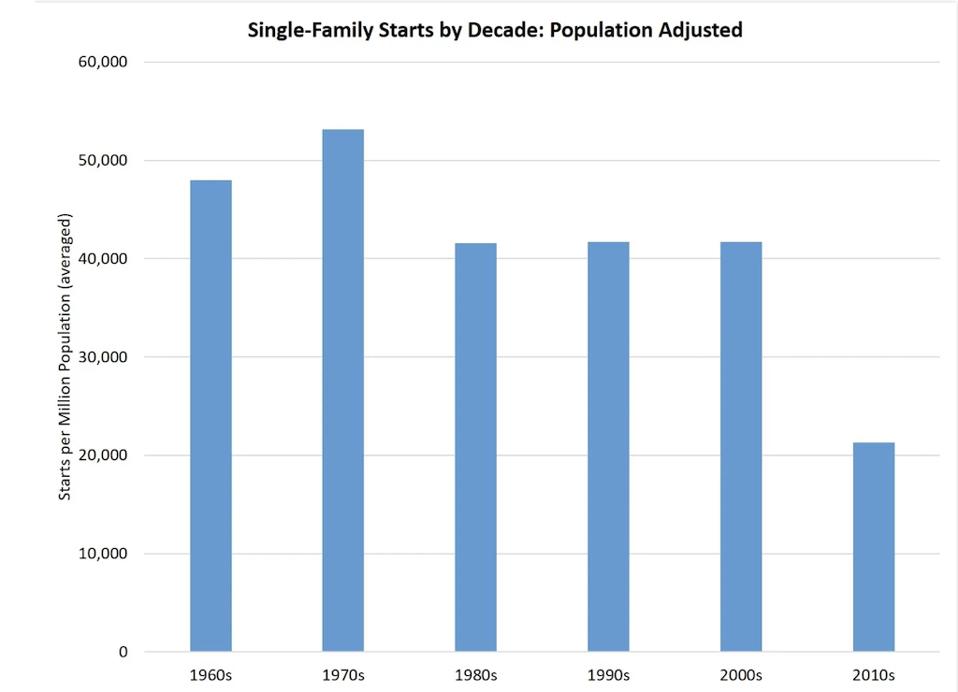
A number—21,288—has gained outsized importance among investment and new capital put-in-place assumptions. The data point is a ratio, and—plugged into machine learning algorithms for new home’s outlook—it’s driving today’s market. Land buys, house price-escalator strategies, capital lending terms, pacing estimates, labor costs, etc. map some degree of reversion to norm factor into the future. Still, if Wall Street’s sudden September sputter and skid presage a wider, deeper, more protracted crater of consumer sentiment—a risk to home builders, developers, and investors who’re plunging pell-mell into the land fray.
The thing everyone knows about the number is that it’s low, historically, wildly low. In fact, U.S.-home builders and developers have produced, on average, more than double that figure per 1 million population in every decade—except the past one from 2010 to 2020—dating back to the 1960s. In fact, the average population-adjusted annual single-family starts per million people, from 1960 to 2010, was 45,220.
That the past decade averaged such abnormally low annual new-home production per million people suggests a supercharge into the stretch ahead. The energy and urgency in today’s land rush, to a strong degree, reflect this measure of pent-up demand—to the tune of 2.3 million new single-family home units crying to be offered to the market.
Still, before one completely dismisses the 2010 to 2020 decade as the anomaly, and bets big money on a reversion to the norm of the prior six decades, it behooves one to ask:
- Have household incomes, on a per-million population basis, kept pace in the past 10 years with the prior 60?
- How do average costs-per-square-foot and average selling prices compare—adjusted for inflation—with the prior decades of higher new home production rates per million?
- How to birth rates—a big driver of new homeownership demand—per million population compare?
- Have rent-by-choice rates compared, apples to apples, with population per million in the past 10 years?
We’d tend to believe that a 50- or 60-year “norm”—45,000 annual new single-family homes per million U.S. population—should serve well-enough as a rule to invest into the future, and that’s what the home builders, capital investors, and developers are doing. Broadly, demography is destiny in their view.
However, one day in the future, we may look back through a 100-year lens’ perspective, and understand that the 1960-through-2010 frame unleashed its own unique array of economic forces of growth and energy that—in the end—do not prove to be the norm. After all, 21,288 may merely be a number.
What—in the meantime—may serve as more telling and bankable bellwethers of future demand? Perhaps, market-by-market measures of the rate at which household incomes reach buying power for new home construction in those markets for starters. Current market affordability indices that look at and compare median incomes with median home prices don’t quite capture rates of change of material interest to builders.
Too, while online new home search behavior spiked in the initial stay-in-place months of the pandemic, and engage-to-conversion rates help up a strong correlation, what’s happened with search-to-engage-to-conversion rates since? Any directional trend shifts to second-derivative growth would be critical right now, as pandemic health challenges, economic wear-and-tear, and an ongoing array of supply constraints put risk into extensive and ever-more-expensive land pipelines.
Demography may, in fact, continue to secure its ennobled designation as destiny. What it may not be—however—is a smart way to look around the next corner, and bet money on what’s there.