

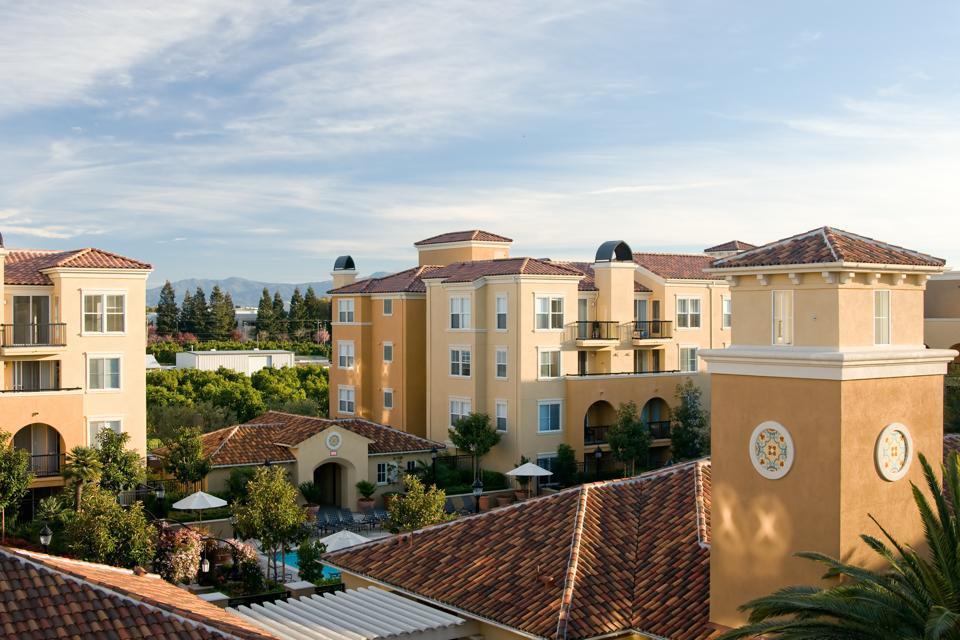
In Los Angeles, a salary of least $124,080 is needed to buy a home with a median price of $649,600.
Getty
The dream of homeownership is alive and well for many Americans despite considerable obstacles, including rising home prices, saving for a down payment and student debt.
Real estate and data analytics provider CoreLogic today released its Home Price Insights report for October 2019, which shows home prices rose both year over year and month over month. Home prices increased nationally by 3.5% from October 2018. On a month-over-month basis, prices increased by 0.5% in October 2019. All 50 states posted an annual increase in home prices.
For would-be buyers in six metropolitan areas, that means the bar has been set higher. In fact, a recent analysis by mortgage data provider HSH.com finds homeownership continues to be out of reach for all but the highest earners in these metro areas.
To arrive at its figures, HSH.com used the latest quarterly home-price information from the National Association of Realtors. It incorporated local property tax and homeowners insurance costs to calculate the income needed to qualify for a median-priced home in a given market.
HSH.com calculated the annual before-tax income required to cover the mortgage’s principal, interest, property tax and homeowner’s insurance payment. The study also used industry-standard mortgage-to-debt earnings ratios and a 20% down payment subtracted from the median home price data. The median price is the figure in the middle of a data set in which half of the houses are priced for less and half are priced for more.
“Nationally, over the past year, home prices are up 3.5% with the rate of growth accelerating from September into October,” said Frank Martell, president and CEO of CoreLogic. “We expect home prices to rise at least another 5% over the next 12 months. Interestingly, this persistent increase in home prices isn’t deterring older Millennials. In fact, 25% of those surveyed anticipate purchasing a home over the next six to eight months.”
Here’s a look at six metro areas where you would need to earn a six-figure annual salary to buy a median-priced home.
San Jose, California, is the the most expensive region in the country for buying a home.
Adobe Stock
1. San Jose, California
In the San Jose metro area, you need to earn at least $228,998 to afford the median-priced house at $1.24 million with a 30-year fixed-rate mortgage at 4.03% and a 20% down payment, making it the most expensive region in the country. The monthly payment would be $5,343. One catch: If you only put down 10%, you would need a salary of $265,622 because a smaller down payment means both a larger loan amount and the need to pay for private mortgage insurance, which in turn means even higher salary requirements.
2. San Francisco
If you’re in the market to buy a home in San Francisco, you’ll find the median home price is $964,000. If you want to buy a house in the City by the Bay, you will need to earn at least $182,486. The monthly payment would be $4,258. If house hunters in the San Francisco metro area put 10% down instead of 20%, the required salary increases to approximately $210,958.
3. Los Angeles
In the densely populated city of Los Angeles, the salary drops to $124,080 to buy a home with a median price of $649,600. The monthly payment would be $2,895. If buyers in the Los Angeles metro area put 10% down instead of 20%, the required salary increases to about $143,266.
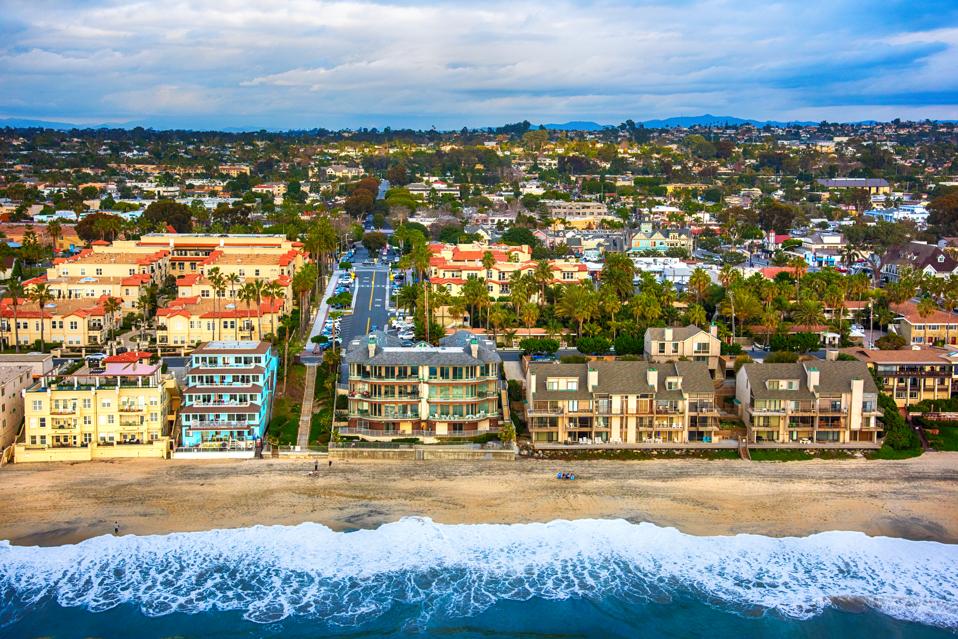
Aerial view of condos lining the beach in the northern San Diego community of Carlsbad, California.
Getty
4. San Diego
While home prices in the San Diego metro area are lower than in San Jose and San Francisco, you would still need to earn at least $122,645 to buy a home with a median price of $645,000. The monthly mortgage payment would be nearly $2,862. If buyers put 10% down instead of 20%, the required salary rises to about $141,695.
5. Boston
Would-be buyers in the Boston metro area would need to earn at least $103,993 to purchase a home with a median price of $507,400. The monthly payment would be $2,426.52. If buyers put 10% down instead of 20%, the required salary increases to $120,311.
6. New York City
A home buyer needs to earn at least $102,428 to buy a home in the New York metro area with a median price of $440,200. The monthly payment would be $2,390. If home buyers put 10% down instead of 20%, the required salary rises to $116,585.
Seattle; Washington, D.C; Denver; and Portland, Oregon round out the top 10 of the most expensive metros on the list, although the salaries needed to buy median-priced homes in these areas were not in the six-figure range in the third quarter of 2019. For example, a buyer needs to earn at least $99,282.58 to buy a home in the Seattle metro area with a median price of $520,200.
Potential homebuyers of more modest means looking to buy homes often struggle to come up with a down payment and closing costs, especially in heated markets. To help would-be homebuyers, HSH offers a database of Homebuyer Assistance Programs by state, where information about these programs and contact information can be found.
Real estate data provider PropertyShark has been tracking the most expensive Zip codes for years, analyzing nationwide residential transactions to provide a snapshot of the most expensive markets.
As has increasingly been the case throughout the years, California was once again the uncontested leader of pricey Zip codes. Hitting an all-time high in 2019, California claimed a jaw-dropping 91 Zip codes of the 125 Zips featuring the 100 most expensive medians, including six of the 10 priciest.
Although New York state is far from a true rival of California’s sky-high residential prices, it remained the East Coast’s most expensive market, ranking 18 Zips in PropertyShark’s top 100 – the second-highest number and just one Zip less than last year.


Tourists sit in front of the Vessel at Hudson Yards in New York City in August.
AFP via Getty Images
Manhattan’s Zip 10001 surged 71% year-over-year, thanks to Hudson Yards’ price performance. After all, in the third quarter of 2019, Hudson Yards dethroned TriBeCa as New York City’s most expensive neighborhood for the first time in almost two years. With a median sale price of $2,525,000, Zip code 10001 placed 24th nationally, up from last year’s ranking of 92.
California’s growing domination of the top 100 Zip codes comes as no surprise, according to PropertyShark, considering the dynamic price growth recorded in the state’s most important metros. Nearly half of metro Los Angeles’ markets saw their medians rise at least 20% in just five years, while a third of the Bay Area underwent price surges of 40% or more.